Thursday 17 December 2015

Lab Report : Practical 4(b) Particle Size and Shape Analysis Using Microscope


TITLE:

Particle Size and Shape Analysis Using Microscope

DATE:

17th November 2014

OBJECTIVE:

1.      To analyze and interpret the size and shape of particles with different samples.

2.      To observe and compare the different size of particles under microscope for each samples.

INTRODUCTION:

            In achieving optimum production of efficacious medicines, the dimensions of particulate solids is one of the dominant factor. When drug is synthesized and formulated, the particle size of drug and other powder is determined and this influences the subsequent physical performance of the medicine and the pharmacological of the drug. This is because powder with different particle sizes have different flow and packaging properties, which alter the volumes of powder during each encapsulation or tablet compression event. For example, the particles which are having small dimensions will tend to increase the rate of solution.

              In order to obtain equivalent diameters, the particle size of powder have to be analyzed and interpreted. The bulk properties such as particles size and shape of the powder are determined by using the size of particles. There are various method that can be used to determine particle sizes and shapes. Microscopic analysis is the most widely used method in this case. It can determine the diameter, shape, and surface area that cannot be determined with the bare eye. 

            In this experiment, different sizes and shapes of sands are used as analogue to powder. Various type of sands (150µ, 355µ, 500µ, 850µ, mixed) and two different powders (MCC and lactose) are given to be analyze. Sand is a naturally occurring granular material composed of finely divided rock and mineral particles. Sand is used in this experiment as it is inert, easy to obtain and economical. It exists in various different sizes ranging from 0.0625 mm (or 1⁄16 mm) to 2 mm.  Fine sand is defined as particles between 0.02 mm and 0.2 mm while course sand as those between 0.2 mm and 2.0 mm. 
LISTS OF APPARATUS
Light Microscope
Weighing Boat
Spatula
Glass slide and cover slip
LISTS OF CHEMICALS
Sands( 150µ, 355µ, 500µ, 850µ, mixed )
Lactose powder
MCC powder
PROCEDURE
1. Sands with sizes of 150µ, 355µ, 500µ, 850µ, mixed, lactose and MCC are placed in the different weighing boats using spatula. The weighing boats are labeled according to the content.
2. The microscope was set up and ready to be use.
3. 150µ sand is scattered and made fairly flat on the surface of the glass slide, covered with the cover slip. The particles were separated one with another to prevent from redundant particle on one place.
4. The sand was observed under the microscope using 4x100 magnification and 10x 100 magnification.
5. The particles were observed microscopically and the shape was determined.
6. The shape and size of particles had been drawn and analyzed
7. Steps 3 to 6 were repeated by using 355µ, 500µ, 850µ, mixed sands, lactose and MCC powder.
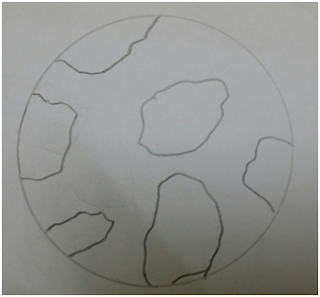
RESULTS
150 mic
Magnification : 4x100
 
Magnification : 10x100
 
 
355 mic
Magnification: 4x100
 
Magnification: 10x100
 
500 mic
Magnification: 4x100


Magnification: 10x100


850 mic
Magnification: 4x100
                                      
 
Magnification: 10x100


Various Size
Magnification: 4x100
 
Magnification: 10x100

MMC
Magnification: 4x100

Magnification: 10x100


Lactose
Magnification: 4x100
 
Magnification: 10x100


DISCUSSION
Different types of sands and powders including 150 micron sands, 355 micron sands, 500 micron sands, 850 micron sands, sands of various sizes, MCC power, and lactose powder were examined by using light microscope. Light microscope was used in this experiment because the samples analyzed have particle size range from 0.1 micrometer to 100 nanometers.
The experiment was carried out to determine the size and shape of the different samples. From the observation, the shape of the sand particles is asymmetry and irregular whereas the shape of powders is almost constant and regular for all particles. The particle shape can be categorized by its sphericity, and characterized into very angular, angular, sub-angular, sub-rounded, rounded and well-rounded.
It is impractical to determine the particle size for more than one dimension as the particles are irregular with different number of faces. The size analysis is carried out on two-dimensional image of particles which are generally assumed to be randomly oriented in 3-dimensional. Therefore, the solid particle is approximate to a sphere and the particle size is analyzed by determining its equivalent diameter. There are different types of equivalent diameters which include projected perimeter diameter, projected area diameter, Feret’s and Martin’s diameter. The projected perimeter diameter is based on a circle having the same perimeter as the particle. The projected area diameter is based on a circle of equivalent area to that of the projected image of a solid particle. Feret’s diameter is the mean distance between two parallel tangents to the projected particle perimeter while Martin’s diameter is the mean chord length of the projected particle perimeter.
There are precautions must be taken in this experiment. All the observations should be done under the same magnification so that the comparison between the different samples in terms of size and shape can be done. During the preparation of the slide, the sand particles is spread and dispersed evenly on the slide until it appeared as a thin layer to avoid agglomeration.
 
QUESTIONS
1) Explain in brief the various statistical methods that you can use to measure the diameter of a particle.
The various statistical methods that use to measure the diameter of particles are projected perimeter diameter, projected area diameter, Feret’s diameter and Martin’s diameter. The projected perimeter diameter is based on a circle having the same perimeter as the particle. The projected area diameter is based on a circle of equivalent area to that of the projected image of a solid particle. Both of these methods are independent upon particle orientation and only take into account of 2 dimensions of the particle. Feret’s diameter is the mean distance between two parallel tangents to the projected particle perimeter while Martin’s diameter is the mean chord length of the projected particle perimeter. Both of these methods consider the orientation of the particle. Both Martin’s diameter and Feret’s diameter are used in particle size analysis by electron microscopy
2) State the best statistical method for each of the samples that you have analyzed.
The best statistical method is Feret’s and Martin’s diameter.
 
CONCLUSION
The shape of the both MCC and lactose powder is regular whereas the shape of various types of sands is irregular. The particle size of the samples in ascending order is lactose powder, MCC powders, 150 micron sands, 355 micron sands, 500 micron sands, 850 micron sand. In sands of various sizes, some of the sands having the largest size among all types of sands.
 
REFERENCE
1) Pharmaceutics, The science of dosage form design (2nd Edition) Michael E.Alton Edinburgh London New York Philadophia St Louis Sydney Toronto 2002.
2) Physicochemical Principals of Pharmacy (2nd Edition) AT Florence and D.Attwood, The Macmillan Press Ltd.


Saturday 5 December 2015

Lab Report : Practical 4(a) Sieving


TITLE
Sieving

 
OBJECTIVES

(i.)   To determine the particle size of lactose and microcrystalline cellulose (MCC).

(ii.)  To determine the size distribution of lactose and microcrystalline cellulose (MCC).

 
DATE OF EXPERIMENT

19 November 2015

 
INTRODUCTION      

Sieves are commonly used to break down agglomerates and determine the size and size distribution of a particular powder. Sieving is probably the most frequently used method of analysis because the equipment, analytical procedure, and basic concepts are simple. The particle size distribution is defined via the mass or volume. Sieve analysis is used to divide the particulate material into size fractions and then to determine the weight of these fractions. In this way a relatively broad particle size spectrum can be analyzed quickly and reliably.

During sieving the sample is subjected to horizontal or vertical movement. This causes a relative movement between the particles and the sieve; depending on their size, the individual particles either pass through the sieve mesh or are retained on the sieve surface. The likelihood of a particle passing through the sieve mesh is determined by the ratio of the particle size to the sieve openings, the orientation of the particle and the number of encounters between the particle and the mesh openings.
 

Sieve analyses in the laboratory and for quality assurance are carried out with sieve shakers. Modern sieve shakers are characterized by the fact that their mechanical parameters, such as sieving time and amplitude or speed, are carried out with exact reproducibility. In the laboratory a differentiation is made between horizontal sieve shakers and throw-action sieve shakers. The basic analytical method involved stacking the sieves on top of one another in descending order (largest diameter to the smallest, from top to bottom) and placing the test powder on the top sieve.

In this practical, students are given two common excipients used in tablet formulations, namely lactose and microcrystalline cellulose (MCC). Using sieve shaker, the particle size and size distribution of both powders are determined.


LIST OF APPARATUS

 
sieve shaker and stack of sieves
 
 
weighing scale


LIST OF CHEMICALS
 
 
lactose
 
 
microcrystalline cellulose (MCC)
 
 
EXPERIMENTAL PROCEDURES
1.  100g of lactose was weighed.


2.  The sieve nest was prepared in descending order (largest diameter to the smallest, from
     top to bottom).


3.  The powder was placed at the uppermost sieve and the sieving process was allowed to
      proceed for 20 minutes.


4.  Upon completion, the powder collected at every sieve was weighed and the particle size
     distribution was plotted in the form of a histogram.


5.  The above process was repeated using MCC.


RESULTS

Lactose

Sieve diameter
(µm)
Particle size (µm)
Mass of lactose retained in the sieve (g)
% lactose retained  =
(weight of lactose in sieve / total weight) × 100%
Cumulative percentage retained (%)
% passing = 100% - cumulative percentage retained
< 53
0 < x ≤ 53
 
7.3190
7.3190
7.3190
92.6810
53
53 < x ≤ 150
 
80.1245
80.1245
87.4435
12.5565
150
150 < x ≤ 212
 
1.1823
1.1823
88.6258
11.3742
212
212 < x ≤ 300
 
10.5231
10.5231
99.1489
0.8511
300
300 < x ≤ 500
 
0.3421
0.3421
99.4910
0.5090
500
x > 500
 
0.0267
0.0267
99.5177
0.4823

 
Microcrystalline cellulose (MCC)

Sieve diameter
(µm)
Particle size (µm)
Mass of MCC retained in the sieve (g)
% MCC retained  =
(weight of MCC in sieve / total weight) × 100%
Cumulative percentage retained (%)
% passing = 100% - cumulative percentage retained
< 53
0 < x ≤ 53
 
0.5412
0.5412
0.5412
99.4588
53
53 < x ≤ 150
 
92.3256
92.3256
92.8668
7.1332
150
150 < x ≤ 212
 
2.0101
2.0101
94.8769
5.1231
212
212 < x ≤ 300
 
4.5673
4.5673
99.4442
0.5558
300
300 < x ≤ 500
 
0.0445
0.0445
99.4887
0.5113
500
x > 500
 
0.0267
0.0267
99.5154
0.4846


QUESTIONS

1.  What are the average particle size for both lactose and MCC?
     The average particle size for both lactose and MCC is in the range of 53µm - 150µm. It is
     because the percentage of lactose and MCC retained is the highest.

2.  What other method can you use to determine the size of particle?
The other methods to determine the size of particle include LA - 960 laser diffraction technique,  SZ - 100 dynamic light scattering technique, PSA300 and CAMSIZER image analysis technique, microscopy, sedimentation, optical and electrical sensing zone method.
 
       (i.)  LA - 960 laser diffraction technique

The LA-960 combines the most popular modern sizing technique with state of the art refinements to measure wet and dry samples measuring 10 nanometers to 5 millimeters. The central idea in laser diffraction is that a particle will scatter light at an angle determined by that particle’s size. Larger particles will scatter at small angles and smaller particles scatter at wide angles. A collection of particles will produce a pattern of scattered light defi ned by intensity and angle that can be transformed into a particle size distribution result.


       (ii.)  SZ - 100 dynamic light scattering technique
              The SZ-100 nanoPartica Dynamic Light Scattering (DLS) system measures particle        size, zeta potential, and molecular weight from 0.3 nm to 8 μm at concentrations ranging from 0.1 mg/mL of lysozyme to 40% w/v.
 
        (iii.) PSA300 and CAMSIZER image analysis technique
                Two types of image analysis exist, namely static image analysis and dynamic  image analysis. The samples measured by static image analysis typically rest on a slide that is moved by an automated stage. With the PSA300 static image analysis system a microscope and digital camera collect images of the particles as the slide is scanned. For dynamic image analysis, sample preparation is completely different since the sample itself is moving during the measurement. Sample preparation steps could include an ionizer to mitigate static interactions between particles thus improving flowability or a sample director to specifi cally orientate particles through the measurement zone.


3.  What are the importance of particle size in a pharmaceutical formulation?
      Particle size is important in a pharmaceutical formulation because particle size is directly
      related to drug dissolution and drug solubility. According to Noyes-Whitney equation, dissolution rate is directly proportional to particle surface area. Smaller solid particles suspended in the liquid will be more uniform and no agglomerates will be formed. This can increase the uniformity and efficacy of drugs produced. Besides, smaller size of solid particles will have larger surface area to come into contact with the medium. This can ensure that the medicine produced can dissolve easily in the body system and function effectively when consumed. Furthermore, when the drugs are injected into the body system, small particle size can ensure that the drug particles will not block the blood vessels


DISCUSSION

            Particle size influences many properties of particulate materials and is a valuable indicator of quality and performance. This is true for powders, suspensions, emulsions and aerosols. The size and shape of powders influences flow and compaction properties. Larger, more spherical particles will typically flow more easily than smaller or high aspect ratio particles. Smaller particles dissolve more quickly and lead to higher suspension viscosities than larger ones. Smaller droplet sizes and higher surface charge (zeta potential) will typically improve suspension and emulsion stability. Powder or droplets in the range of 2-5μm aerosolize better and will penetrate into lungs deeper than larger sizes. For these and many other reasons it is important to measure and control the particle size distribution of many products.


            Sieve analysis is performed to determine the particle size distribution of granular materials including sand, crushed rock, clays, feldspars, coal and grains. The most common method used for sieve analysis is sieving. In order to carry out sieving, sieve nest has to be prepared and they are arranged in descending order, from the largest diameter to the smallest diameter. The granular materials used in this experiment are lactose and microcrystalline crystal (MCC). 100g of lactose powder was placed at the uppermost sieve nest. The sieve shaker is then started and the sieving process is carried out for 10 minutes. Later, the lactose powder from each sieve is measured. The principle used to determine the particle size is that particles that cannot pass through a particular sieve nest has larger particle size compared to the diameter of the sieve nest. For example, particles that cannot pass through sieve with diameter 150µm but can pass through sieve with diameter 53µm has particle size range between 53µm and 150µm.

            From the result obtained, the particle size of lactose is estimated to be between 53µm and 150µm because the percentage of lactose retained at sieve with diameter 53µm is the highest. The particle size of MCC is estimated to be between 53µm and 150µm because the percentage of MCC retained at sieve with diameter 53µm is the highest. It can be deduced that lactose has larger particle size compared to MCC because the percentage of lactose retained at sieve with diameter less than 50µm is higher than the percentage of MCC retained at sieve with diameter less than 50µm.

            There are errors throughout the experiment because there is a loss in weight of lactose powder and MCC after the experiment compared to their weight before the experiment. The weight of both lactose and MCC are 100g initially. However, after the experiment, the weight of lactose powder is found to be 99.5177g. The weight of MCC is found to be 99.5154g. This may due to the lactose and MCC powder are not completely removed after the sieving process. Some powders may have been blown away during the vibration of sieve shaker, some of them may have sticked to the sieve nest, some may have spilt out from the sieve nest when we were transferring the powders from the sieve to weighing boat to be weighed. Some of the powders may have been contaminated with other powders as this experiment is carried out using both lactose and MCC.

            A few precautions have to be taken in order to minimise the error. First, the sieves have to be tightly closed when the sieve shaker is operating. The sieves should be cleaned thoroughly before repeating the experiment with another type of powders to prevent contamination. Besides, after the sieving process, the powders have to be removed from the sieve nest to the weighing boat slowly and carefully to prevent the spillage of the powders, causing inaccuracy in the weight of powders in each sieves.


CONCLUSION
In conclusion, the objectives of the experiment are achieved. The particle size and size distribution of lactose and microcrystalline cellulose (MCC) are successfully determined using sieving method. According to the result of the experiment, MCC has smaller particle size than lactose.
 
REFERENCES
Martin,A.N. 2006. Physical Pharmacy: Physical Chemistry Principles in Pharmaceutical     Sciences. 5th Edition. Philadelphia: Lea & Febiger.
Patrick J. Sinko, Yashveer Singh. 2011. Martins Physical Pharmacy and Pharmaceutical Pharmacy Sciences. Ed. ke6. China: Lippincott Williams & Wilkins.  
Jillavenkatesa A, Dapkunas S J, Lin-Sien Lum. 2001. Particle Size Characterization. NIST Special Publication.